2026-10-15 · Feature
Terrain you can read in metres.
The Terrain layer used to be a hillshade over a smooth colour ramp. Hillshade shows slope, not height: a ridge and a gully look the same whether they sit at 160 m or 200 m, and over most of Ukraine the ramp barely changes colour across that whole range. You could hover the cursor and read the elevation in the corner, but the picture itself told you nothing about which way the ground falls.
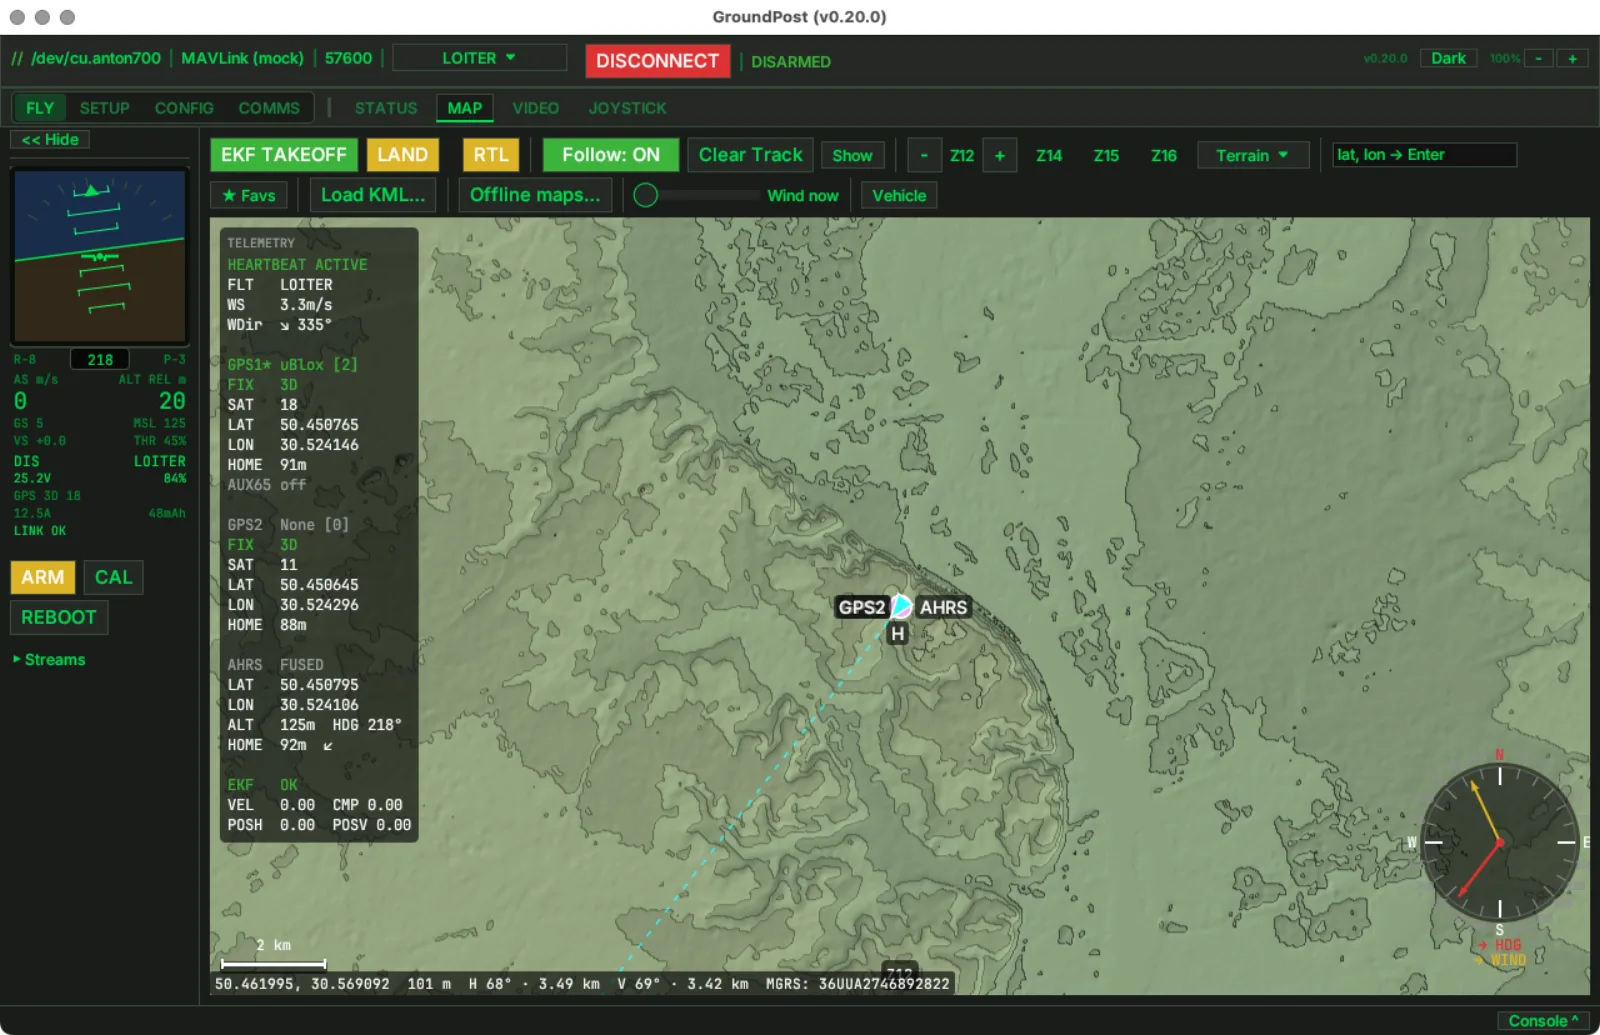
Elevation is now stepped into bands. Each band keeps the colour of the old ramp, odd bands are drawn a touch darker, and every band edge gets a contour line, with every fifth line bold. The result reads like a topographic sheet: a slope shows as a stack of lines, a plateau as an empty band, and a 40 m drop across a field as two lines you can count.
The interval follows the zoom level the way paper maps change scale. At street zoom the bands are 10 m apart, at the regional zoom in the screenshot 20 m, and far out over mountains 500 m, so the Carpathians do not turn into a black smear when you zoom out. One line per pixel means roughly a 45 degree slope at any zoom.
Nothing changes on disk. The tile cache still holds raw elevation data and the bands are computed when a tile is drawn, so offline map packs you already downloaded get the new look for free.
Shipping in the next release · macOS / Windows / Linux